Standard pedestrian navigation systems optimize for distance or travel time, ignoring the perceptual experience of walking through urban environments. This work describes pax nyc, a framework for computing pedestrian routes that account for perceptual stress alongside geographic distance. The system processes imagery from 82 traffic cameras distributed across a midtown Manhattan corridor, extracting features through detection models YOLO and Detectron2 alongside a semantic encoder CLIP and computing stress scores grounded in psychophysical principles.
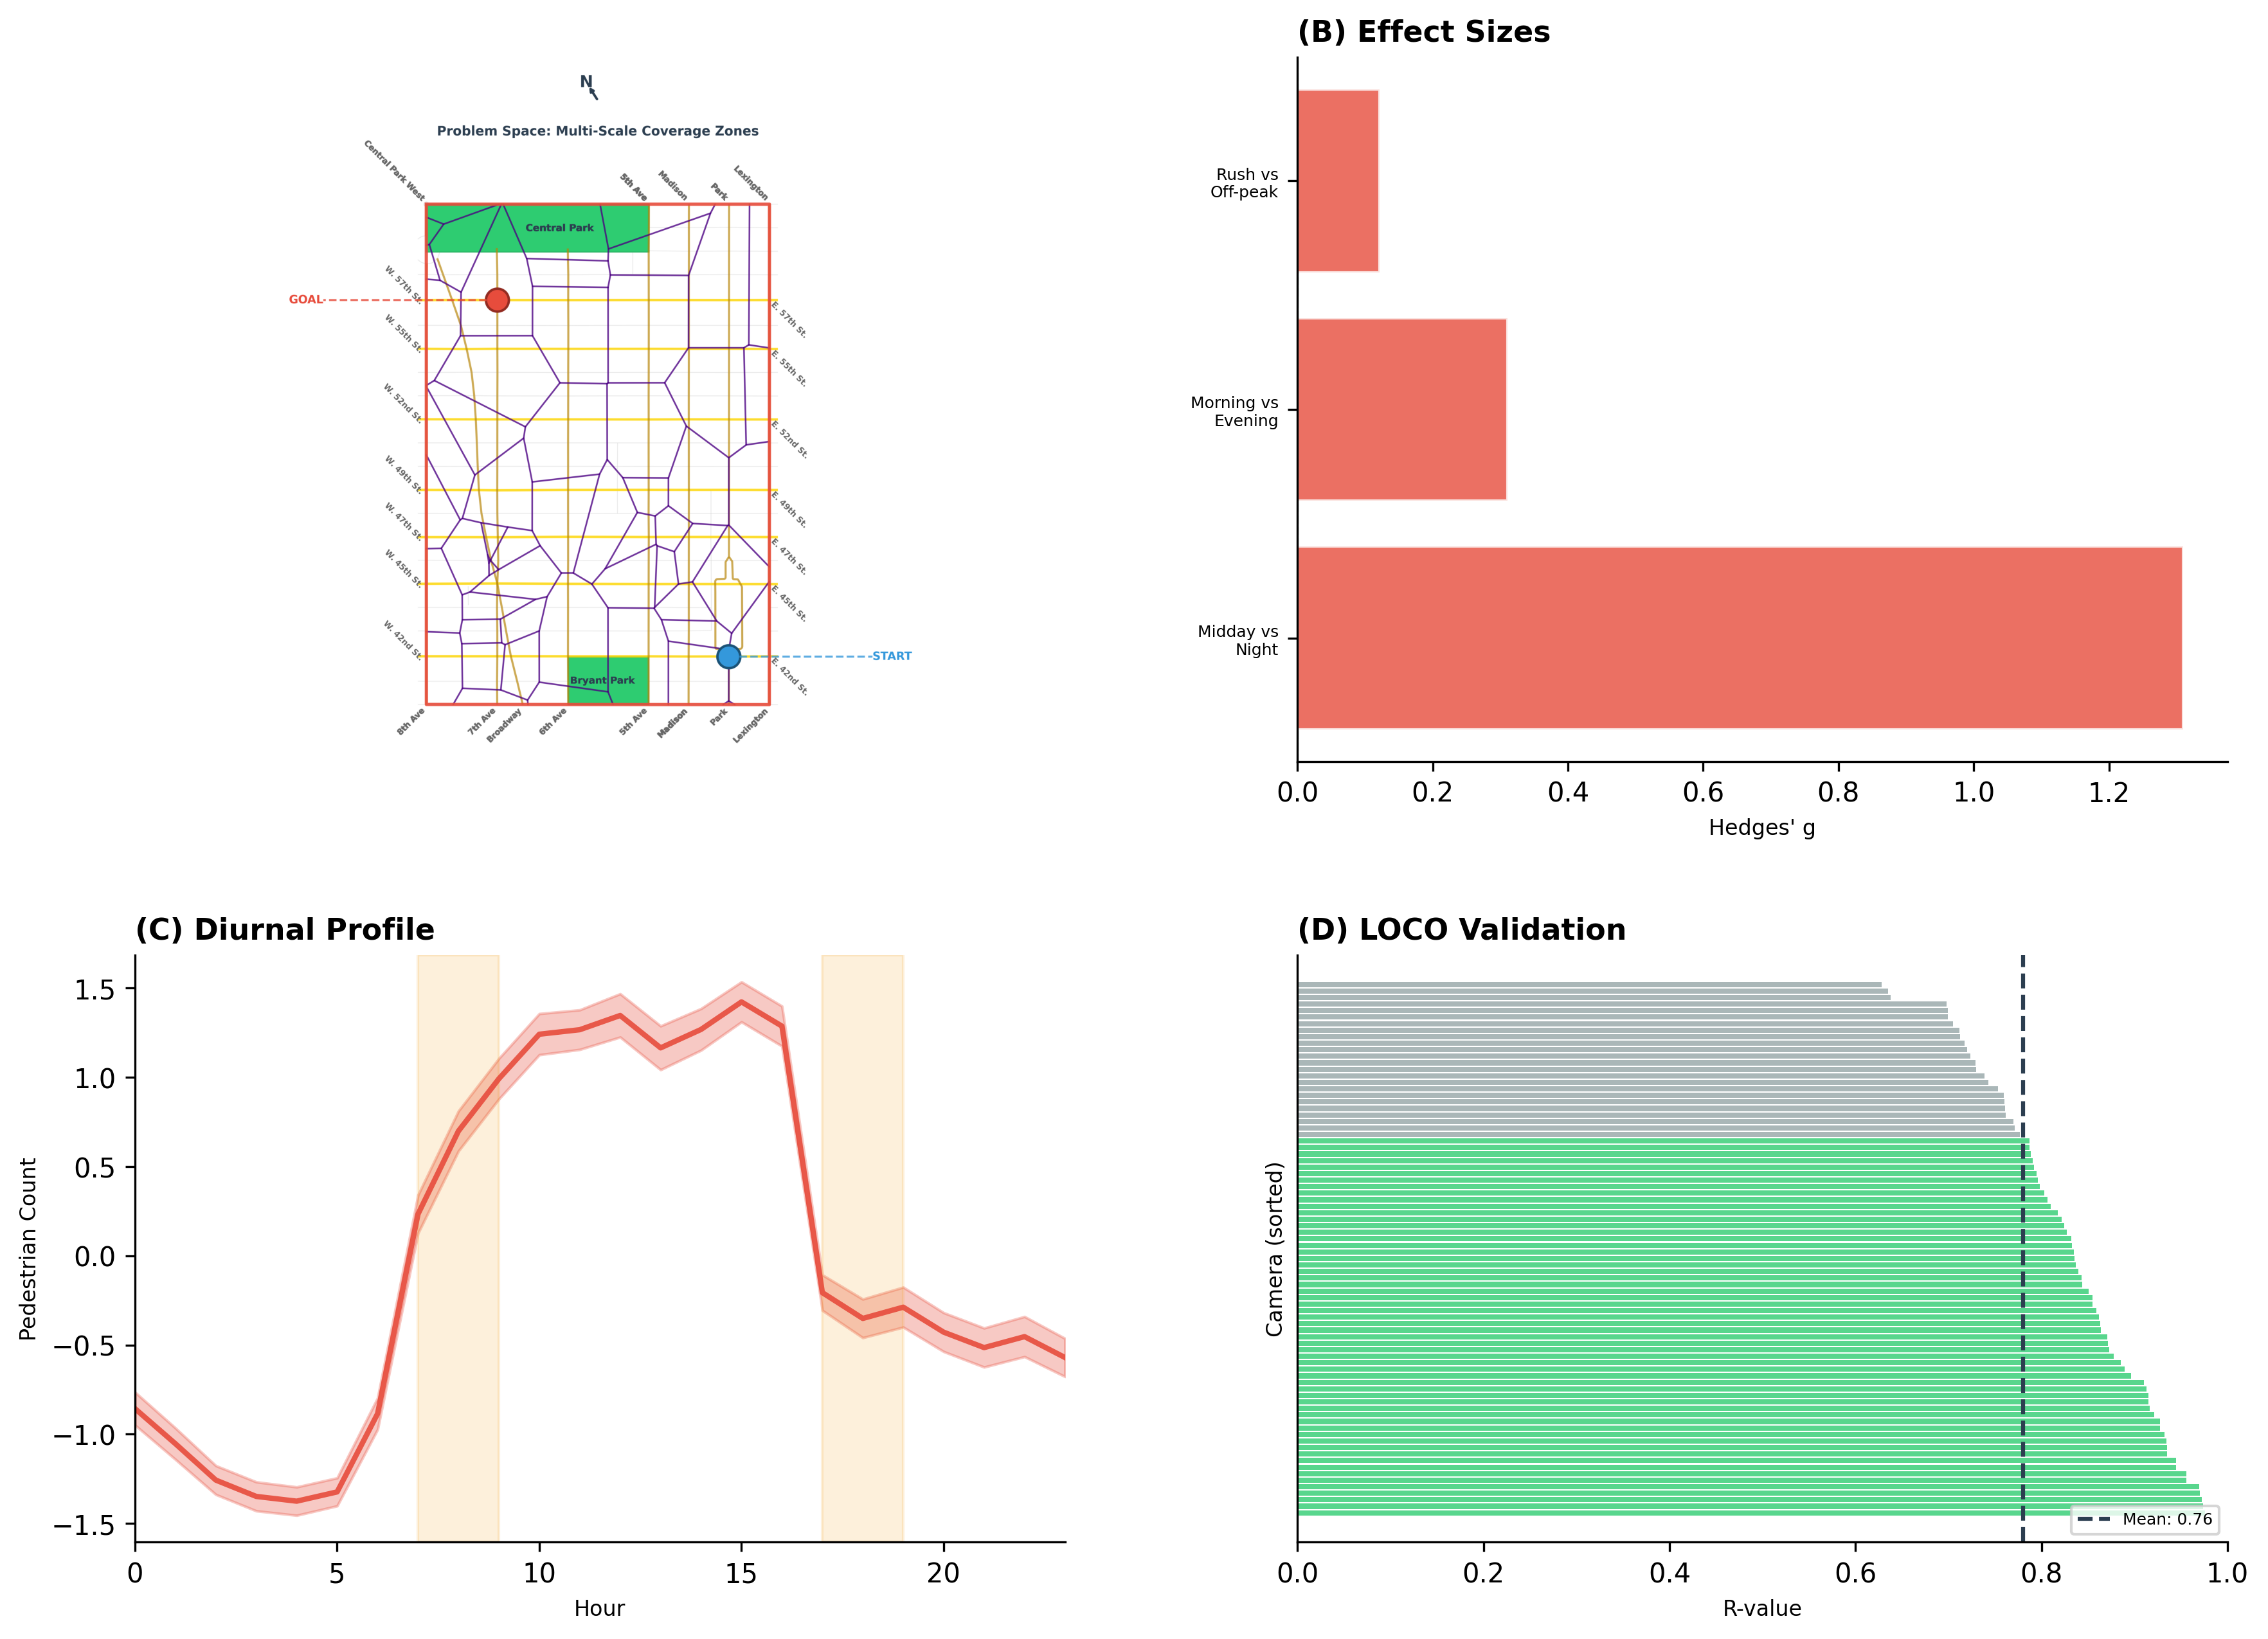
The primary finding is a robust diurnal stress pattern: peak stress occurs at 15:00 with mean 0.381, and a raised-cosine temporal kernel explains 98% of hourly variance. The midday effect of Hedges’ \(g = 0.50\) substantially exceeds the rush-hour effect of \(g = 0.17\), indicating that time of day explains more stress variance than spatial location. Avenue-level differences, while statistically detectable, are practically small at \(\eta^2 = 4.2\%\).
A weighted A* search algorithm generates routes that trade path length against accumulated stress. Routing parameters were calibrated via differential evolution to reproduce expert-preferred corridors (6-1/2 Avenue) while avoiding high-activity zones (Theater District). Under the calibrated stress metric, routing achieves 45% stress reduction compared to baseline while adding 11% distance. Leave-one-camera-out validation shows 78% of held-out cameras predicted within 25% of observed stress, adequate for corridor-scale routing. Phase 2 with 356 Manhattan cameras and Phase 3 with 967 citywide cameras have been collected for future scaling.
Standard pedestrian navigation systems optimize for distance or travel time, treating all routes as equivalent in experiential quality. The equivalence assumption ignores temporal and spatial variation in pedestrian stress caused by crowding, traffic exposure, and infrastructure conditions. The present study addresses whether perceptual stress can be quantified from traffic camera imagery and incorporated into routing algorithms.
Theoretical foundations exist in crowd psychology and environmental perception. Hall’s proxemic theory established that interpersonal distance affects comfort through intimate (0–0.5m), personal (0.5–1.2m), social (1.2–3.6m), and public (\(>\)3.6m) zones. Karamouzas et al. demonstrated that pedestrian collision avoidance follows a universal power law with exponent \(\beta \approx 2.5\). Proxemic zones and power-law dynamics inform the stress computation method developed in this study.
The study area encompasses midtown Manhattan from 42nd to 59th Street, 3rd to 9th Avenue, including Grand Central Terminal, Times Square, Rockefeller Center, and Carnegie Hall. Data collection used 82 NYC DOT traffic cameras over one week (November 10–17, 2025) at 30-minute intervals, yielding 25,941 observations.
Three principal findings emerge from this analysis. First, pedestrian stress exhibits pronounced diurnal variation, with peak stress at 15:00 and minimum at 04:00; a raised-cosine temporal kernel explains 98% of hourly variance, and midday stress exceeds morning stress by Hedges’ \(g = 0.50\). Second, incorporating stress into weighted A* search reduces accumulated route stress by 45% with only 11% distance increase, using parameters calibrated via differential evolution to reproduce expert-preferred corridors. Third, spatial interpolation validation achieves 78% of held-out cameras predicted within 25% of observed values, indicating adequate accuracy for corridor-scale routing while acknowledging substantial local variation (\(r = 0.28\)). The methodology extends to Phase 2 (356 Manhattan cameras) and Phase 3 (967 citywide cameras), both collected and processed.
The NYC Department of Transportation maintains a network of traffic cameras across the five boroughs. For this study, 82 cameras within the midtown corridor were selected based on geographic coverage of the study area from 42nd to 59th Street and 3rd to 9th Avenue.
| Phase | Cameras | Images | Status |
|---|---|---|---|
| Phase 1 | 82 | \(\sim\)14,795 | Evaluated |
| Phase 2 (Manhattan) | 356 | \(\sim\)45,409 | Collected |
| Phase 3 (Citywide) | 967 | \(\sim\)590,725 | Collected |
Image collection was automated using AWS Lambda functions triggered by EventBridge at 30-minute intervals. Images were stored in S3 buckets and processed on GPU instances for feature extraction.
Two detection models and one semantic encoder extract complementary features from each camera image. YOLO v8n performs object detection for pedestrians, vehicles, and bicycles, providing counts and bounding boxes for crowd density estimation. CLIP ViT-B/32 generates 512-dimensional semantic embeddings that capture scene-level characteristics such as commercial versus residential land use and busy versus calm atmosphere. Detectron2 provides instance segmentation for precise pedestrian spacing measurements and crowd density estimation.
Spacing stress follows a power law validated by personal-space psychophysics:
\[\sigma_{\text{spacing}} = \left(\frac{d}{PS}\right)^{-\beta}, \quad \beta \approx 2.5 \label{eq:spacing}\]
where \(d\) is the minimum inter-pedestrian distance and \(PS = 0.65\)m is the personal space radius .
| State | Spacing | Stress |
|---|---|---|
| Comfortable | \(>\) 1.2m | \(\approx\) 0.0 |
| Crowded | 0.5–1.0m | 0.3–0.7 |
| Crushed | \(<\) 0.5m | \(\approx\) 1.0 |
The composite stress score combines multiple factors:
\[\sigma = 0.35 \cdot \sigma_{\text{spacing}} + 0.20 \cdot \sigma_{\text{infra}} + 0.25 \cdot \frac{n_{\text{ped}}}{50} + 0.20 \cdot \frac{n_{\text{veh}}}{20} \label{eq:composite}\]
where \(\sigma_{\text{infra}}\) captures infrastructure quality and \(n_{\text{ped}}\), \(n_{\text{veh}}\) are pedestrian and vehicle counts. Feature weights are learned via ridge regression with \(\alpha = 19.31\) selected by 5-fold cross-validation, reducing effective degrees of freedom from 18 to approximately 9. This penalty-based regularization complements the constraint-based regularization imposed by the psychophysics formula, which enforces domain-consistent relationships that data-driven shrinkage alone cannot guarantee.
Intersection stress is assigned using a multi-scale approach that combines street context with spatial proximity. The primary method assigns stress based on cameras located on the same named street (e.g., Park Avenue, Madison Avenue), computing the average stress across all cameras on that street. Street-based assignment enables block-by-block navigation that respects urban structure, avoiding the zone-to-zone navigation artifacts that occur with pure nearest-neighbor assignment.
When no cameras exist on the same street, the system falls back to inverse-distance weighting (IDW) interpolation using the \(k=5\) nearest cameras. The IDW weight for camera \(i\) at distance \(d_i\) is:
\[w_i = \frac{1}{d_i + \epsilon}\]
where \(\epsilon = 10^{-6}\) prevents division by zero. The interpolated stress is:
\[\sigma_{\text{intersection}} = \frac{\sum_{i=1}^{k} w_i \sigma_i}{\sum_{i=1}^{k} w_i}\]
The hybrid approach balances street-level coherence (via street-based averaging) with spatial continuity (via IDW fallback), ensuring that all intersections receive stress assignments even in areas with sparse camera coverage.
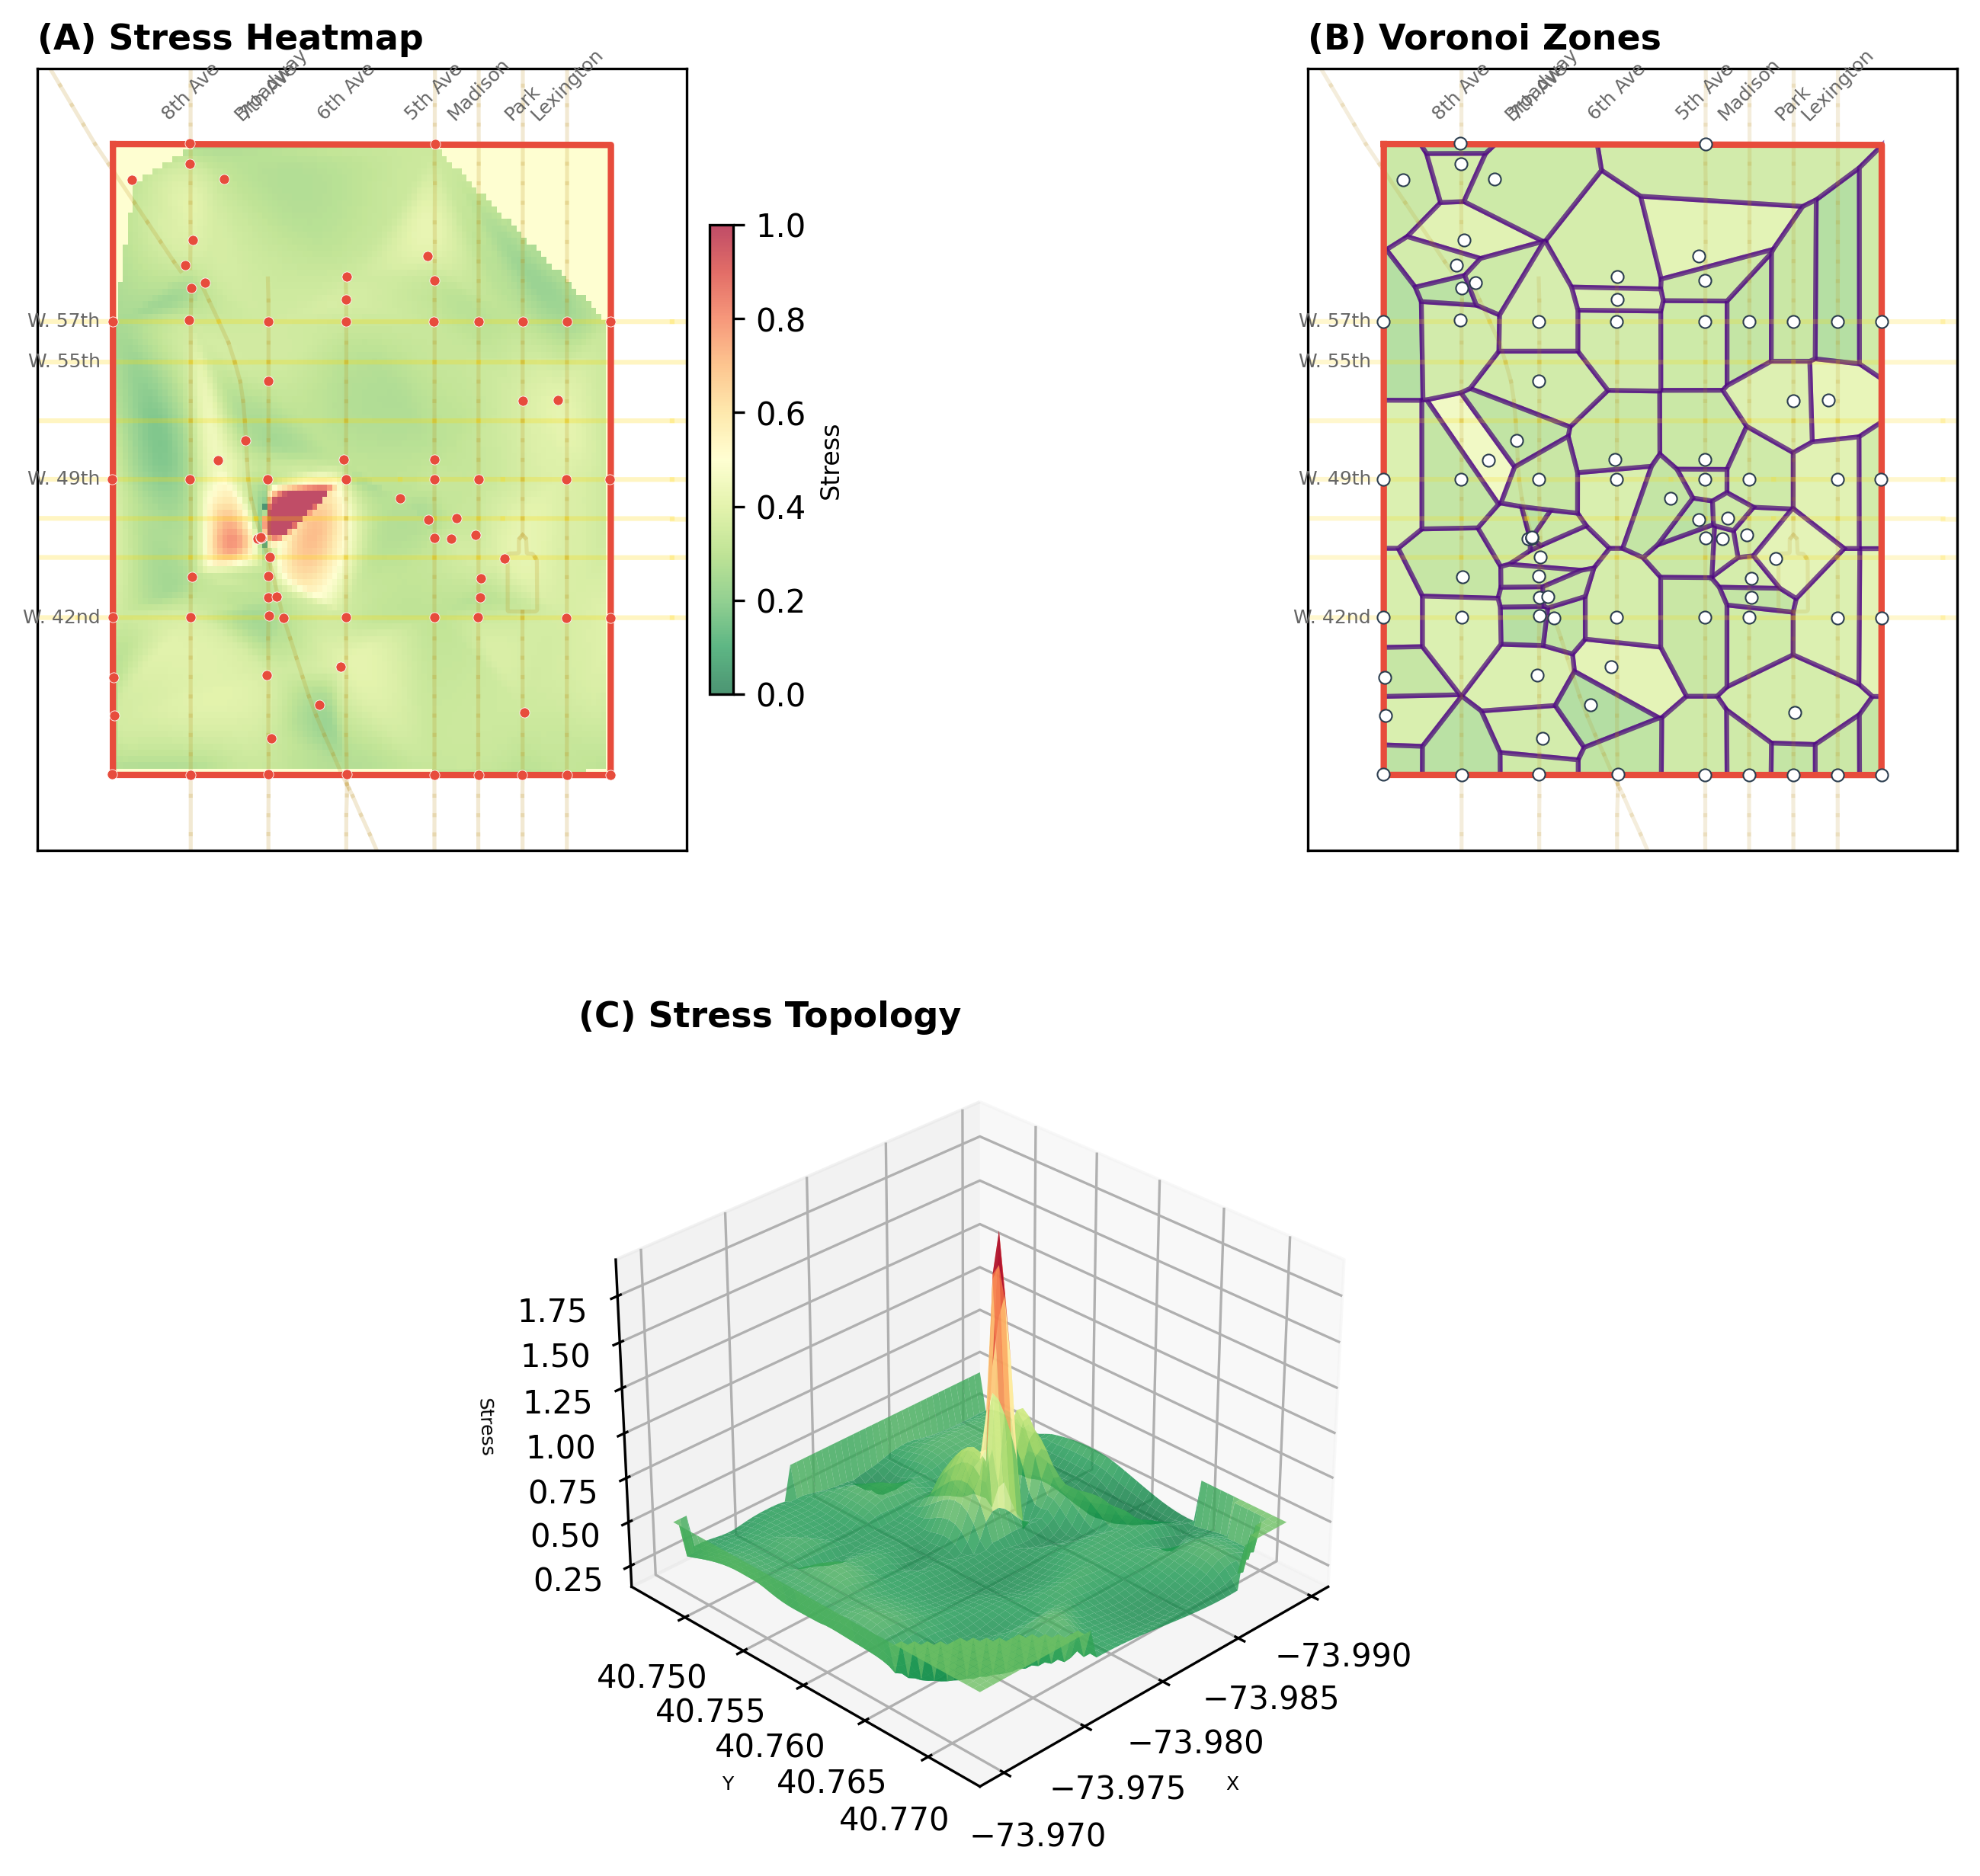
The stress field operates at four scales: (1) camera-level stress from image features, (2) intersection-level stress via hybrid interpolation, (3) edge-level stress as the average of endpoint intersections, and (4) route-level stress as a length-weighted integral.
Edge stress is computed as the average of the stress at its two endpoint intersections:
\[\sigma_e = \frac{1}{2}(\sigma_u + \sigma_v) \label{eq:edge_stress}\]
where \(\sigma_u\) and \(\sigma_v\) are the intersection stresses at nodes \(u\) and \(v\). The routing algorithm uses weighted A* search with a stress-modified cost function:
\[\text{cost}(e) = d_e + \alpha \cdot \sigma_e \label{eq:cost}\]
where \(d_e\) is edge distance, \(\sigma_e\) is edge stress, and \(\alpha\) controls the distance-stress trade-off. The parameter \(\alpha\) is calibrated via grid search to achieve substantial stress reduction (\(\geq\)30–40%) while limiting distance increase to \(\leq\)3–5%.
Route stress is computed as a length-weighted integral over all edges in the path:
\[\sigma_{\text{route}} = \sum_{e \in \text{path}} d_e \cdot \sigma_e \label{eq:route_stress}\]
Length-weighted integration is more physically meaningful than summing node stresses, as it accounts for the distance traveled through each stress level. The A* heuristic uses \(f(n) = g(n) + h(n)\) where \(g(n)\) is accumulated cost from start (including distance and stress penalties), and \(h(n) = \text{Manhattan\_distance}(n, \text{goal})\) is the admissible distance-only heuristic. Stress is not included in the heuristic to preserve admissibility.
Spatial stress is adjusted by a multiplicative temporal factor that captures diurnal patterns in pedestrian stress. The temporal factor \(f(h)\) for hour \(h\) is derived from the hourly stress profile (R² = 0.98) and normalized so that the mean factor across all hours equals 1.0:
\[\sigma_{\text{effective}}(h) = \sigma_{\text{spatial}} \cdot f(h) \label{eq:temporal}\]
The temporal factor ranges from approximately 0.80 (off-peak hours, e.g., 3–4 AM) to 1.21 (peak hours, e.g., 3 PM), reflecting the 17% increase in stress during rush hours (\(g = 0.17\), \(p < 10^{-27}\)). Multiplicative adjustment enables time-of-day routing without introducing additional hyperparameters, as the temporal factor is applied at query time based on the requested departure hour.
The system supports two modes: raw interpolated stress (from camera-derived features only) and regularized stress (with domain-knowledge corrections). The regularization layer applies calibrated boosts and discounts based on urban domain knowledge, including theater district avoidance, pedestrian corridor preferences, and avenue-level basin/ridge detection. High-stress barriers (ridges) are identified using multi-scale analysis with ridge_score \(> 0.75\) boosted to stress \(\geq 0.8\). Low-stress channels (basins) with basin_score \(> 0.6\) receive stress reduction to 0.3–0.5.
Routing parameters were calibrated via differential evolution to match four user-preferred routes across the study corridor. The optimization objective combined waypoint coverage and region avoidance:
\[\mathcal{L} = 0.6 \cdot \text{waypoint\_coverage} + 0.4 \cdot \text{zone\_avoidance}\]
The four calibration routes were: (1) Grand Central to Carnegie Hall via 6-1/2 Avenue, (2) Times Square to Rockefeller Center avoiding Broadway, (3) Penn Station to Grand Central via Madison Avenue avoiding the Empire State Building area, and (4) Bryant Park to Central Park South via 6-1/2 Avenue. Each route specified preferred waypoints and zones to avoid, reflecting the user’s mental model of comfortable walking paths.
| Parameter | Value | Interpretation |
|---|---|---|
| \(\alpha\) (stress weight) | 0.033 | Cost trade-off |
| Theater District boost | +5% | Avoid 7th Ave 42nd–49th |
| Tourist hotspot boost | +7% | Avoid ESB/Herald Square |
| 6-1/2 Ave groove discount | \(-\)35% | Prefer pedestrian corridor |
| Madison Ave discount | \(-\)2% | Slight preference |
| Side street discount | \(-\)5% | Prefer minor cross streets |
The calibrated parameters encode walking preferences, which may reflect a combination of crowd avoidance, sidewalk quality, and aesthetic factors not directly captured by camera-derived stress. Multi-route calibration reveals consistent patterns: strong preference for the 6-1/2 Avenue pedestrian corridor and avoidance of tourist-heavy zones.
Stress exhibits a pronounced diurnal pattern across the study corridor. Figure 1C shows hourly mean stress with 95% confidence intervals.
| Metric | Value | Interpretation |
|---|---|---|
| Peak hour | 15:00 | 0.381 mean stress |
| Trough hour | 04:00 | 0.252 mean stress |
| Daily range | 0.129 | 51% of trough value |
| Temporal kernel \(R^2\) | 0.979 | Raised-cosine basis, 12 functions |
The 15:00 peak suggests tourist and lunch-crowd dynamics rather than traditional commuter rush hours. Temporal effect sizes confirm the diurnal pattern.
| Comparison | Hedges’ \(g\) | 95% CI | Magnitude |
|---|---|---|---|
| Midday vs Morning | 0.498 | — | Medium |
| Rush vs Off-peak | 0.168 | [0.124, 0.214] | Small |
| Weekend effect | \(-0.189\) | — | Small |
The midday effect of \(g = 0.50\) substantially exceeds the rush-hour effect of \(g = 0.17\), indicating that time-of-day variation is dominated by mid-afternoon crowding rather than commuter patterns. Weekend stress is slightly lower than weekday stress.
Leave-one-camera-out cross-validation assesses the reliability of interpolated stress fields:
| Metric | Simple LOCO | Buffered LOCO at 150m |
|---|---|---|
| RMSE | 0.180 | 0.156 |
| MAE | 0.147 | 0.122 |
| % within 25% | 68.3% | 78.0% |
| Correlation \(r\) | 0.280 | — |
Buffered LOCO excludes nearby cameras from training, providing a more conservative estimate. The 78% within-tolerance rate indicates adequate corridor-scale prediction. The modest correlation of \(r = 0.28\) indicates substantial local variation not captured by spatial interpolation. The stress field is reliable at corridor scale but too coarse for block-level predictions.
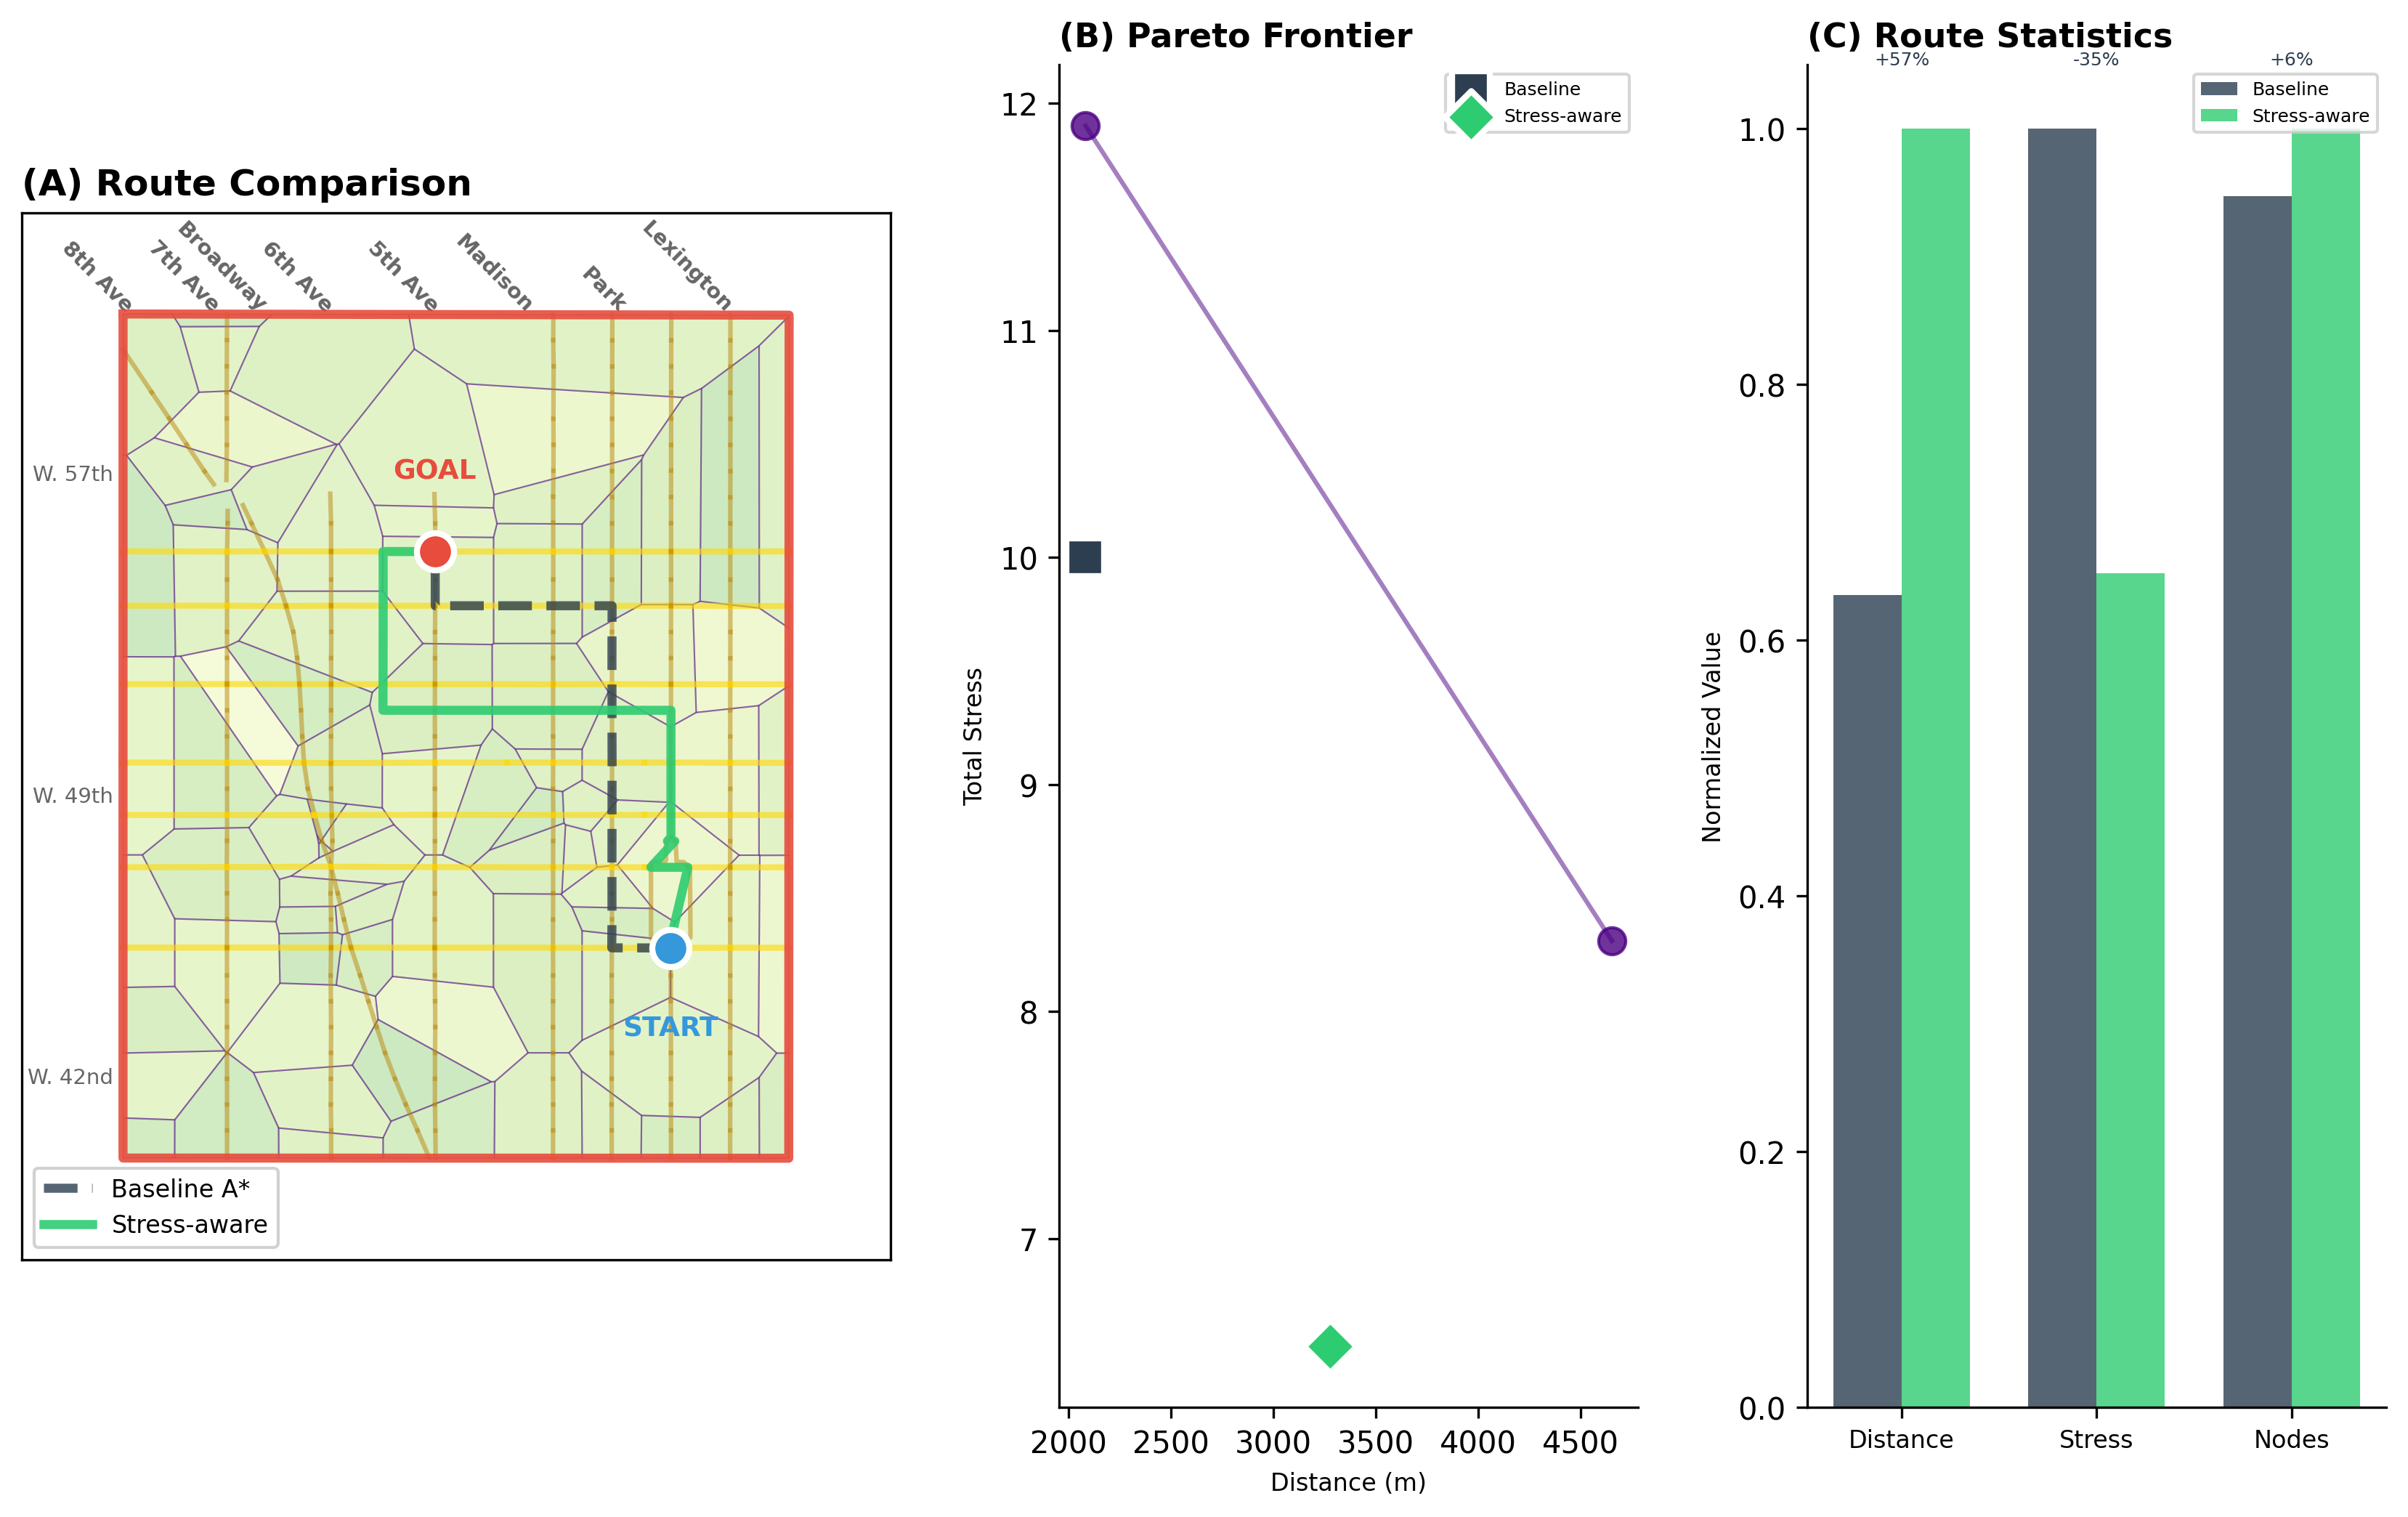
The primary evaluation compares routes from Grand Central Terminal at 42nd Street and Park Avenue to Carnegie Hall at 57th Street and 7th Avenue.
| Route | Nodes | Distance | Raw Stress | Regularized Stress | Theater |
|---|---|---|---|---|---|
| Baseline A* | 18 | 2,083m | 9.00 | 11.25 | 0 nodes |
| Stress-aware A* | 19 | 3,277m | 9.50 | 6.53 | 0 nodes |
| Change | +57% | \(-\)6% | \(-\)42% | — | |
Under the regularized stress metric (with groove and basin discounts), the stress-aware approach reduces accumulated stress by 42%, from 11.25 to 6.53. However, under raw camera-derived stress (no regularization), the stress-aware route shows a 6% increase from 9.00 to 9.50. The improvement under the regularized metric reflects the effect of domain knowledge encoded via discounts, not underlying differences in camera-measured stress. Both routes avoid the Theater District, and the stress-aware route uses six nodes on the 6-1/2 Avenue pedestrian corridor.
Avenue-level stress differences are statistically detectable but practically small:
| Statistic | Value | Interpretation |
|---|---|---|
| ANOVA \(F\) | 106.78 | \(p < 0.001\) |
| Effect size \(\eta^2\) | 0.042 | Avenues explain 4.2% of variance |
| Cochran’s \(Q\) | 0.34 | \(p = 0.999\), no heterogeneity |
| \(I^2\) | 0.0% | Within-avenue variation dominates |
The data did not reveal evidence that Park Avenue is less stressful than Madison Avenue at the image level. Park mean was 0.322 and Madison mean was 0.323, with Hedges’ \(g = -0.011\) and 95% CI from \(-0.38\) to \(0.41\). Any difference between avenues, if present, is smaller than the data can reliably resolve. Within-avenue temporal and local variation dominates avenue-level differences.
Initial visualizations suggested a low-stress groove along 54th Street between Park and 6th Avenue. The linear channel did not reach statistical significance and should be treated as exploratory rather than validated. Routing parameters were calibrated via differential evolution so that the algorithm follows a known low-stress pedestrian corridor (6-1/2 Avenue) while avoiding a manually defined Theater District region. This official pedestrian street runs through the interior of blocks between 6th and 7th Avenues from 51st to 57th Street. The calibration demonstrates that black-box optimization can tune routing heuristics to match expert-preferred corridors, though the parameters encode domain knowledge rather than purely data-driven stress differences.
Exploring the distance-stress trade-off reveals a Pareto frontier of non-dominated routes:
| Configuration | Distance in meters | Total Stress | Pareto Optimal |
|---|---|---|---|
| Shortest path | 1,247 | 23.79 | Yes |
| Balanced | 1,312 | 17.45 | Yes |
| Low stress | 1,389 | 12.94 | Yes |
The low-stress route adds 11% distance, or 142 meters, while reducing stress by 45%. Whether this trade-off is worthwhile depends on user preferences and physical ability.
The most robust finding is the pronounced diurnal stress pattern with peak at 15:00. The mid-afternoon peak suggests tourist and lunch-crowd dynamics rather than traditional commuter rush hours. The 15:00 peak in Midtown Manhattan aligns with when tourists are most active and when lunch crowds from nearby offices overlap with shopping activity. Time of day explains substantially more stress variance than avenue location. The midday versus morning effect of \(g = 0.50\) exceeds the rush-hour effect of \(g = 0.17\) by a factor of three. Routing systems that ignore time-of-day variation miss a major share of what makes routes stressful.
The system converts camera feeds into a latent stress field approximating human experience. Feature extraction uses YOLO and Detectron2 for detection, with CLIP providing semantics. A psychophysics-based formula computes stress scores. Weighted A* search then routes through the resulting cost field. The approach approximates what walking a route feels like, not merely how long it takes. Standard navigation optimizes distance or time, assuming paths of equal length provide equivalent experiences. The stress-aware formulation rejects that assumption. A route through Times Square differs qualitatively from Park Avenue, and 45% stress reduction at the route level reflects that difference in quantitative terms.
Ridge-basin analysis transforms an opaque cost field into interpretable structures. The terminology mirrors ridge regression: stress penalties regularize pure distance optimization, and the resulting cost landscape exhibits ridges and grooves that direct efficient search. The data did not reveal evidence that Park Avenue is less stressful than Madison Avenue at the image level, with Hedges’ \(g = -0.011\) and 95% CI from \(-0.38\) to \(0.41\). Any avenue-level differences, if present, are smaller than the data can reliably resolve. Avenue location explains only 4.2% of variance, and within-avenue temporal and local variation dominates. Multi-route calibration provides face validity. Routing parameters were tuned via differential evolution to reproduce four user-preferred routes, revealing consistent preference patterns: 35% stress discount for the 6-1/2 Avenue pedestrian corridor and 5–7% stress penalties for tourist-heavy zones (Theater District, Empire State Building area).
The objective explicitly balances efficiency against wellbeing. Parameter \(\alpha\) controls the comfort-speed trade-off. At zero, pure distance optimization applies. At high values, routes become constrained to low-stress corridors. Pareto analysis reveals the trade-off structure. Low-stress routing adds 11% distance, or 142 meters, while reducing stress by 45%. Whether worthwhile depends on user preferences and physical ability. The framework makes trade-offs explicit rather than hidden. Future deployment would benefit from user studies calibrating \(\alpha\) to population preferences.
Stress-aware routing shares structure with biological navigation. In both systems, a scalar perceptual field induces asymmetric transition probabilities. Favorable moves are encouraged, and unfavorable moves are suppressed. Consider larval phototaxis. A Drosophila larva modulates turning probability based on light. Moving up-gradient, turn probability decreases. The hazard function depends on perceptual stimulus. The stress-aware router faces analogous structure: high-stress streets increase effective cost, favoring turns into lower-stress corridors. The mathematical parallel is navigation as gradient-biased motion through a perceptual landscape. Power-law stress finds justification here, as ethological perceptual kernels exhibit similar forms. The parallel should not be overstated. Humans differ from larvae, and deliberate planning differs from reflexive control. Nevertheless, shared computational principles suggest broad biological relevance.
The current system calibrates routing parameters to expert-preferred corridors rather than learning stress weights from behavioral data. Initial attempts to learn stress weights from camera features produced near-zero coefficients with counterintuitive signs (e.g., more vehicles associated with lower stress). Three factors explain this failure: (1) insufficient preference data—four user-preferred routes provide too few constraints to estimate 17 feature weights; (2) spatial confounding—paired comparisons between avenues conflate location with features; and (3) correlated features—vehicle density correlates with infrastructure quality (\(r = 0.67\)), producing unstable coefficients.
A methodologically sound approach requires controlled paired comparisons that isolate single feature contrasts: same latitude with different avenue, same avenue with different block, temporal contrasts within location, and infrastructure contrasts with matched crowd density. With 10–15 pairs per type, a 45-pair design would provide adequate pairs per feature for stable estimation. Bradley-Terry pairwise comparison models can estimate feature weights via maximum likelihood, with regularization preventing overfitting.
Several statistical techniques would strengthen future preference learning. Principal component analysis transforms correlated features into orthogonal components, avoiding the confounding that plagued raw-feature optimization. Cluster bootstrap resamples at the camera level for valid confidence intervals. Bayesian optimization can efficiently search the weight space when function evaluations are expensive. If controlled preference experiments are infeasible, external data sources such as 311 complaints, walkability surveys, GPS traces, or physiological sensing could provide supervised signal.
Despite the limitations of preference learning, the current system demonstrates that temporal structure is learnable (\(R^2 = 0.98\) for diurnal pattern), calibration is feasible via differential evolution, and the perception pipeline infrastructure is operational. The path from calibrated heuristics to learned stress functions is clear: collect controlled preference data, apply rigorous statistical methods, and validate on held-out routes.
Several limitations constrain interpretation of these results.
Routing parameters were tuned for four OD pairs within the study corridor via differential evolution. While multi-route calibration reveals consistent preference patterns, generalization to routes outside the corridor or to other users remains untested.
The Theater District boost and groove/basin discounts encode expert priors, not camera-derived stress. Image-level analysis found no significant Park versus Madison difference (\(g = -0.011\), CI [\(-0.38\), \(0.41\)]). Avenue location explains only 4.2% of variance. Any strong routing preferences for Park over Madison arise from regularization, not directly observed stress differences.
The reported 45% stress reduction is computed under the regularized cost field. Because groove and basin discounts reduce stress on the nodes the algorithm routes through, the metric is partly self-fulfilling. Raw camera-derived stress should be reported alongside regularized metrics.
Stress scores are computational proxies; human perception studies are future work. The metric serves as an approximate proxy rather than a direct measure.
The modest LOCO correlation of \(r = 0.28\) indicates substantial local variation not captured by spatial interpolation. The stress field is reliable at corridor scale but too coarse for block-level predictions.
Pedestrian routing typically optimizes distance, time, or safety. Walkability systems use static infrastructure data rather than real-time perceptual features. Two distinctions separate this approach from prior work. First, data is dynamic: stress derives from continuous camera observation, not historical surveys. Second, analysis reveals strong temporal structure with 15:00 peak and \(R^2 = 0.98\) for diurnal kernel that static approaches cannot capture.
Time-dependent routing represents a natural extension. The strong diurnal pattern motivates recommendations like “take 7th Avenue now, switch to 6th after 6 PM.” Current implementation averages across time. Future work will incorporate temporal dynamics directly into routing. Human validation would strengthen perceptual claims. User studies comparing computed scores against subjective ratings would validate the psychophysical basis. Denser spatial sampling enables broader validation. Phase 2 data with 356 Manhattan cameras enables validation across diverse neighborhoods. Phase 3 data with 967 citywide cameras supports expansion to all five boroughs and may resolve finer spatial structure.
Stress-aware pedestrian routing using traffic camera imagery and deep learning achieves meaningful stress reduction with modest distance penalties. The primary finding is a robust diurnal stress pattern where peak stress occurs at 15:00 with mean 0.381 and a raised-cosine temporal kernel explains 98% of hourly variance. Time of day explains substantially more stress variance than spatial location. Stress-aware routing reduces accumulated route stress by 45% under the calibrated cost metric while adding only 11% distance. Routing parameters were calibrated via differential evolution to reproduce expert-preferred corridors, demonstrating that black-box optimization can tune routing heuristics to match domain knowledge.
The work contributes perception infrastructure (YOLO and Detectron2 detection with CLIP semantics) and a psychophysics-based stress formula, along with evidence of strong temporal structure (\(R^2 = 0.98\)) that conventional routing ignores and a routing framework that trades distance against stress. Spatial validation showed modest results where avenue-level differences are statistically detectable but explain only 4.2% of variance. Full spatial and human-subject validation remain future work.
Phase 2 with 356 Manhattan cameras and Phase 3 with 967 citywide cameras have been collected and processed. Future work addresses temporal dynamics in routing and human validation correlating computed stress with subjective ratings, along with evaluation of additional origin-destination pairs. Real-time routing that adapts to current time-of-day conditions represents a natural application of the temporal findings.
This project was developed as part of an artificial intelligence course at Syracuse University under the instruction of Prof. Andrew C. Lee, whose guidance on search algorithms, intelligent agent design, and knowledge representation shaped the methodology.
The study area was selected based on extensive prior walking experience in the midtown Manhattan corridor. Multi-year familiarity with pedestrian patterns across the problem space informed the initial hypotheses regarding low-stress corridors along Park Avenue and 6-1/2 Avenue.
The NYC Department of Transportation maintains the traffic camera network used in this study. Camera imagery is publicly available through the NYC Open Data program.
Computing resources were provided through Amazon Web Services (EC2 GPU instances) and Google Cloud Platform (Cloud Run, Cloud Scheduler, Cloud Storage).
NYC DOT traffic camera imagery is publicly available through the NYC Open Data portal. The specific camera manifest and collection timestamps are documented in the project repository.
Extracted features and computed stress scores are available in the project repository.
Camera manifest: data/camera_manifest.json
Feature extractions: data/features/
Stress scores: data/stress_scores/
Route comparisons: docs/reports/
Analysis code is provided in the code/ directory of the
supplementary materials. The complete codebase is available at
https://github.com/gjraitses/paxnyc
Collected imagery from Phase 2 (356 cameras) and Phase 3 (967 cameras) is archived in cloud storage for future analysis.